Performance Studio
Abstract
Performance Studio is a built-in workbench for authoring and running load/performance tests powered by k6. It lets you turn a recorded browser session or an existing API test case into a k6 script, run it with a configurable load profile, and review the results — all without leaving the IDE.
Prerequisite: k6
Performance Studio drives the open-source k6 load-testing engine. Install k6 and make sure it is available on your PATH before using ingenious perf run/validate. If k6 cannot be found, both the CLI and the IDE panel will show a warning with an install hint.
Download k6 from k6.io/docs/get-started/installation.
Opening Performance Studio
Click the Performance Studio button (speedometer icon) on the main toolbar.

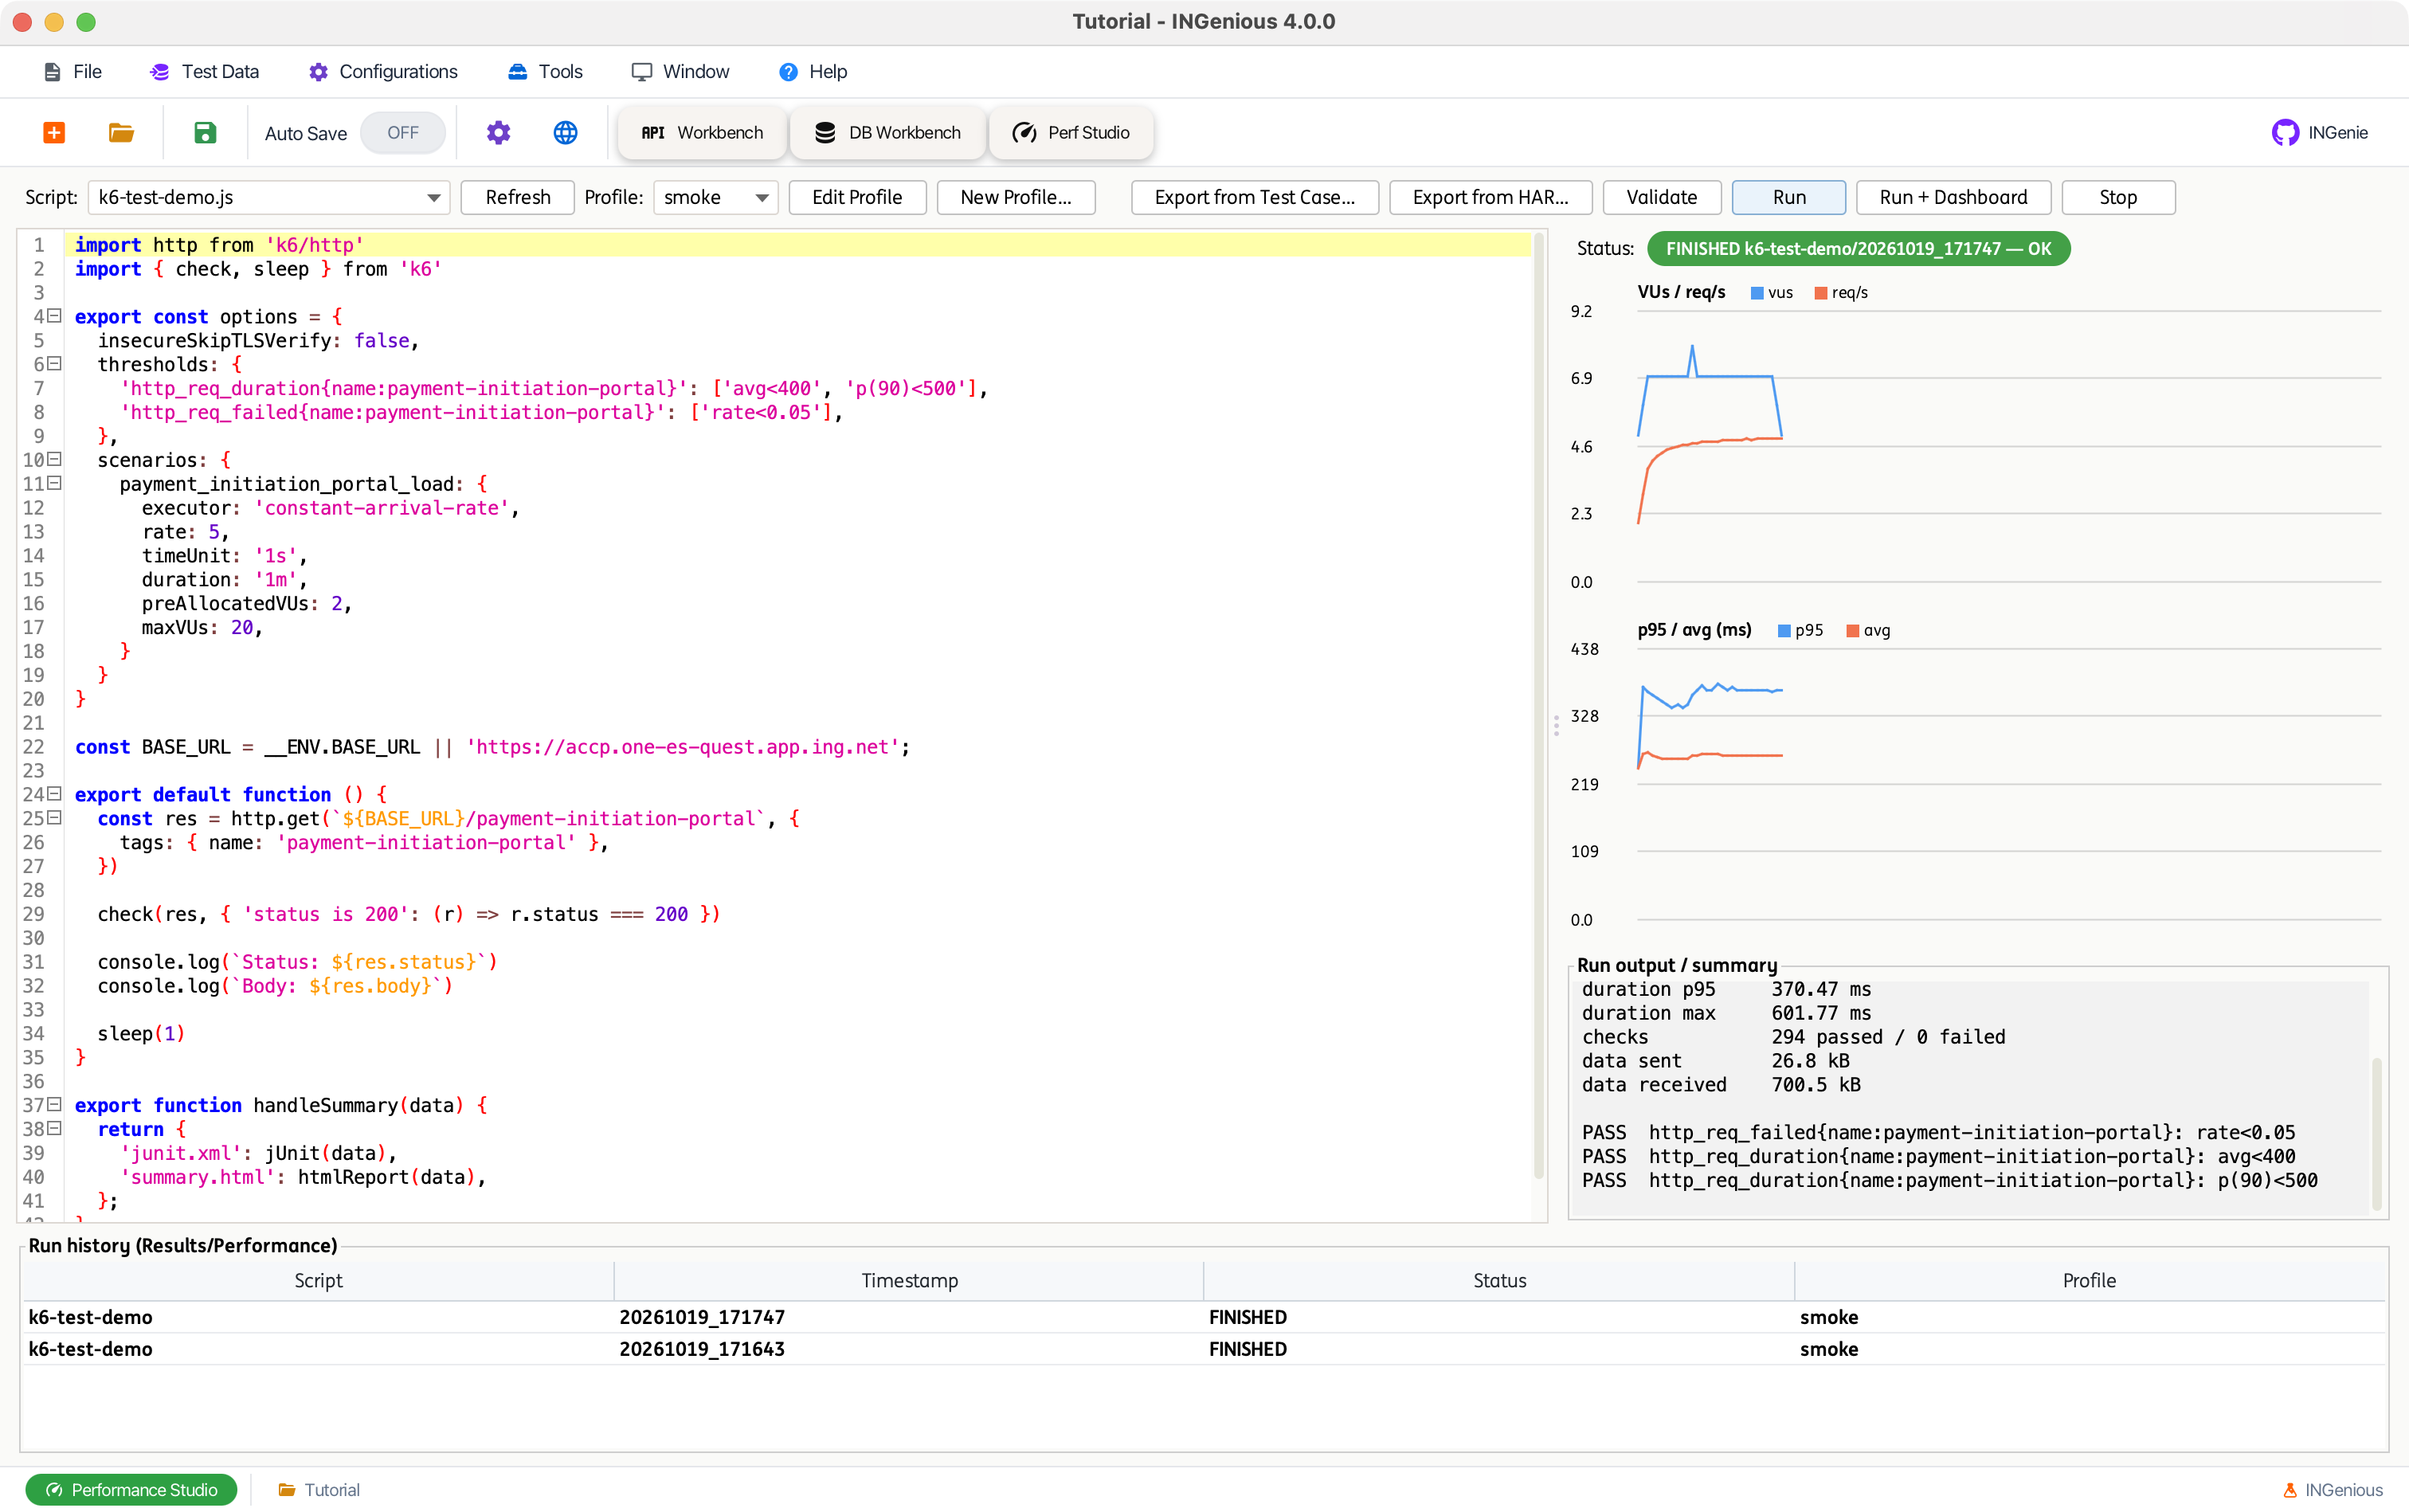
Performance Studio opens as its own panel, next to API Workbench:
Project Folder Layout
Performance Studio artifacts live alongside the rest of your project, under dedicated Performance and Results folders:
<Project>/
├── Performance/
│   ├── scripts/        # generated/hand-edited k6 scripts (.js)
│   ├── profiles/        # load profiles (YAML) — VUs, stages, thresholds
│   ├── recordings/       # recorded browser traffic (.har)
│   └── rules/          # auto-correlation rules extracted from recordings
└── Results/
    └── Performance/
        └── <script>/
            └── <timestamp>/   # run output: summary, logs, k6 dashboard report
Workflow
The typical Performance Studio workflow follows these stages:
Record (optional) → Export → Validate → Run → Report
1. Record browser traffic (optional)
If you don't already have an API test case to export from, record a browsing session to a HAR file:
| Option | Description |
|---|---|
--out |
HAR file path (default: Performance/recordings/<host>_<timestamp>.har) |
--duration |
Stop automatically after N seconds (default: interactive — press Enter to stop) |
--headless |
Record without a visible browser window |
The recorder opens a real browser, captures every request/response, and saves it as a .har file under Performance/recordings/.
2. Export a k6 script
Generate a k6 script either from an existing API test case or from a HAR recording:
| Option | Description |
|---|---|
--type |
Script flavor: http (protocol-level, default) or browser |
--profile |
Load profile baked into the generated script's options (default: smoke) |
--out |
Output script path (default: Performance/scripts/<name>.js) |
--force |
Overwrite a hand-edited script |
--url-filter |
HAR exports only — keep requests whose URL contains this text |
--include-static |
HAR exports only — keep static assets (CSS/JS/images) |
--auto-correlate |
HAR exports only — detect tokens from a response that reappear in a later request, save the correlation rules to Performance/rules/, and apply them automatically |
--rules |
Rules file to apply (default: Performance/rules/<script>.rules.yaml) |
Two export sources
<Project>/<Scenario>/<TestCase>— flattens the test case (inlining anyExecute/User Intent steps) and turns its API steps into a k6 protocol script.- A
.harfile path — turns a recorded browsing session into a k6 script (--type browserfor a Playwright-driven k6 browser script,--type httpfor a protocol-level replay of the captured requests).
3. Validate
Before running a full load test, do a quick 1 VU / 1 iteration debug run with a full HTTP trace:
Use --full to print the entire trace instead of just the tail — useful for diagnosing a failing correlation rule or an unexpected response.
4. Run
| Option | Description |
|---|---|
--vus |
Override the number of virtual users baked into the script's load profile |
--duration |
Override the duration (e.g. 30s, 2m) |
--detach |
Start the run in the background and return immediately; control it afterwards with perf status/logs/scale/cancel |
--dashboard |
Enable the k6 web dashboard (live graphs in the browser, plus an HTML report export); implies --detach |
In the IDE, the panel shows the run live: a status pill (idle/running/completed/failed), a live VUs / requests-per-second chart, and a streaming output console — all without needing the CLI.
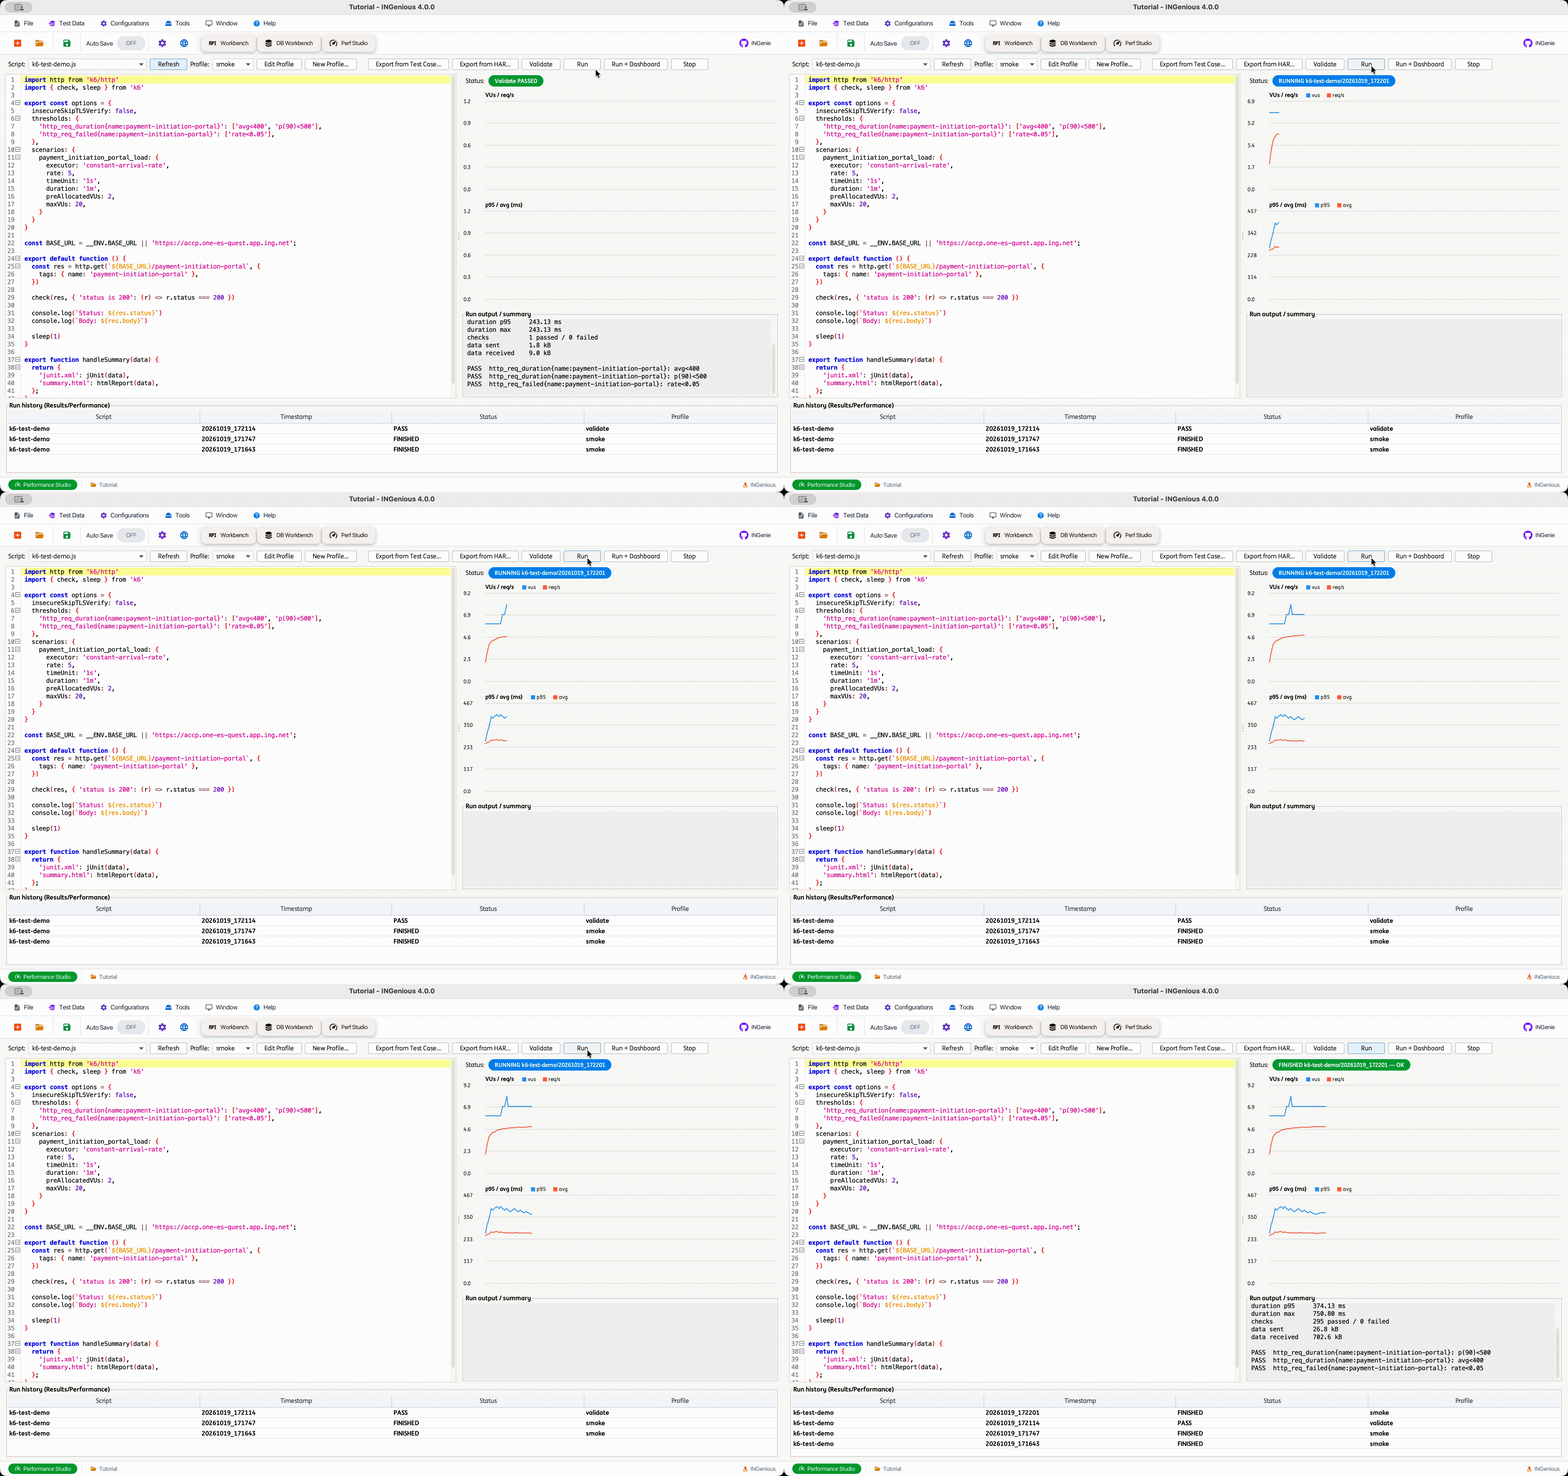
Managing a detached (background) run
| Command | Description |
|---|---|
ingenious perf status [runId] |
Live status + metrics of an async run (defaults to the newest running one) |
ingenious perf logs [runId] [--lines <n>] |
Output of an async run (tails the last n lines, default 40) |
ingenious perf scale <vus> [runId] |
Change the VU count of a running k6 test |
ingenious perf cancel [runId] |
Stop an async run (graceful, then kill) |
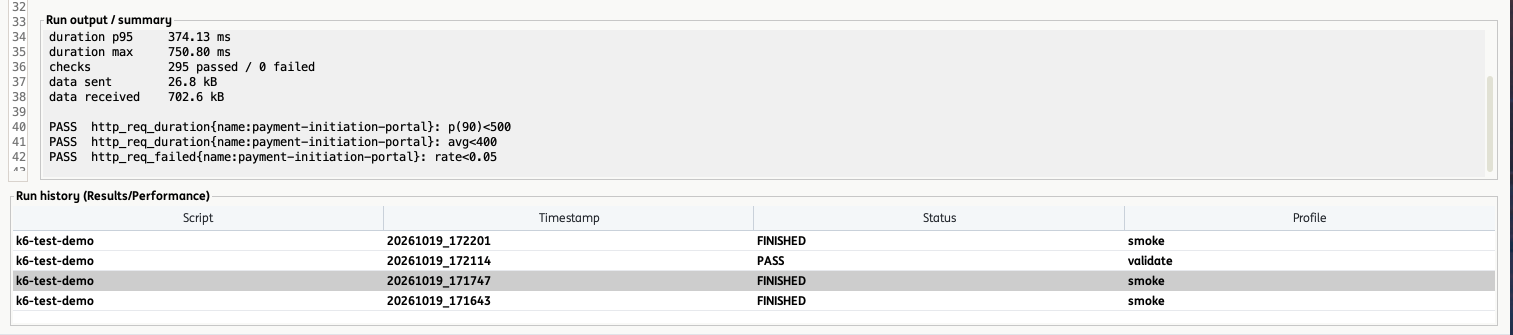
5. Report
| Variant | Description |
|---|---|
report latest (default) |
Show the latest run's summary |
report history |
List previous runs for the current project |
report compare <baselineRunId> <candidateRunId> |
Compare metrics between two runs |
report junit [runId] --out <file> |
Export a run as a JUnit XML report (useful in CI), default stdout |
Load Profiles
A load profile is a reusable YAML definition of VUs/stages/thresholds that gets baked into an exported script via --profile.
| Command | Description |
|---|---|
ingenious perf profile list |
List built-in and project load profiles |
ingenious perf profile show <name> |
Show a profile as YAML |
ingenious perf profile create <name> [--from <template>] [--force] |
Create a new project profile by copying a built-in template (--from, default smoke). Project profiles are stored under Performance/profiles/ |
Listing Artifacts
Lists the scripts, profiles, recordings, or past runs available for the current project.
Quick Reference
| Command | Purpose |
|---|---|
ingenious perf record <url> |
Record browser traffic to a HAR file |
ingenious perf export <target> |
Generate a k6 script from a test case or a .har file |
ingenious perf validate <script> |
Debug run: 1 VU, 1 iteration, full HTTP trace |
ingenious perf run <script> |
Execute a k6 script (load run) |
ingenious perf status/logs/scale/cancel |
Manage a detached (--detach) run |
ingenious perf report [latest\|history\|compare\|junit] |
Show performance run results |
ingenious perf profile list\|show\|create |
Manage load profiles |
ingenious perf list [scripts\|profiles\|recordings\|runs] |
List Performance Studio artifacts |
Note
ingenious perf can also be invoked with its alias ingenious performance. Append --help to any subcommand to see its full option list.